The yield spread (yield curve) has commanded attention as a leading indicator of recession for decades. Yet this signal cannot be trusted blindly. An inversion does not always lead to a recession, and conversely there have been recessions that began without an inversion. The key is training yourself to read the yield curve in context, not as a standalone indicator.
What Is the Yield Spread?
The yield curve is a line connecting the rates on bonds of different maturities. Normally, long-term bonds carry higher rates than short-term bonds. The longer money is lent out, the greater the uncertainty, and investors demand a corresponding premium. This state is called an upward-sloping (normal) yield curve.
The yield spread is generally calculated as the 10-year Treasury yield minus the 2-year (or 3-month) Treasury yield. When the difference is positive (+), the curve is normal; when negative (-), it is inverted. Inversion attracts attention because it signals that market participants are collectively betting that "near-term rates will be higher than far-term rates" — implicitly expecting that the central bank will be forced to cut rates to support the economy.
There are broadly two causes of inversion. First, when a central bank aggressively raises short-term rates to fight inflation, short-term rates can overtake long-term rates. Second, when long-term growth expectations collapse and investors crowd into long-term bonds, pushing long-term yields lower. When both mechanisms combine, the depth of the inversion increases.
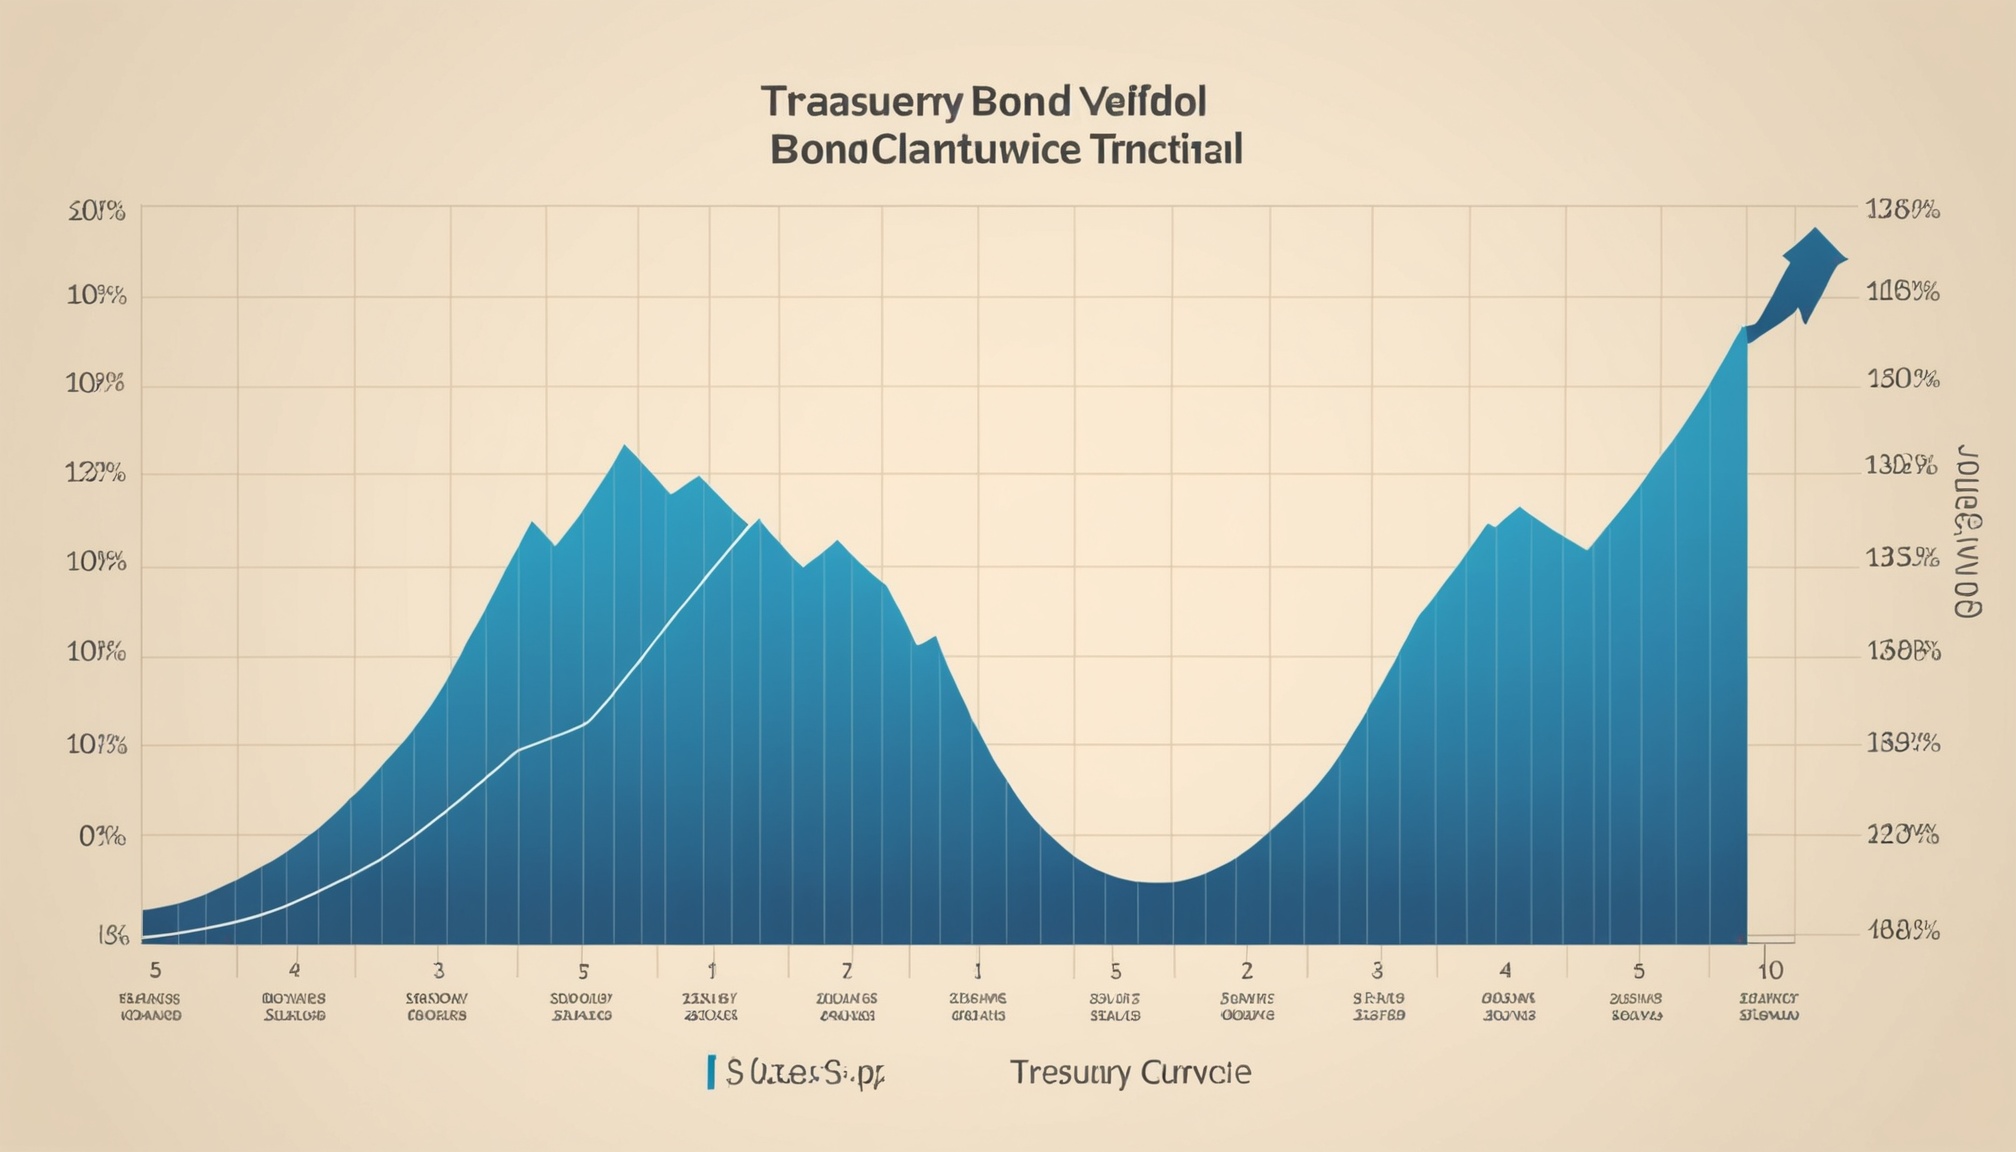
Historical Patterns: When It Has Worked as a Signal and When It Has Been Noise
Yield curve inversion as a recession signal has statistically solid grounding. In the United States since the 1970s, most major recessions have been preceded by yield curve inversions — a fact repeatedly recorded in the academic literature. But there is an important caveat. The lag from inversion to recession has ranged from as little as six months to over two years. Treating the inversion's start date as the recession's start date produces a large judgment error.
More than the inversion itself, the depth and the duration of the inversion determine the actual probability of recession.
There are also cases where the signal amounted to noise. When inversions appeared briefly and normalized quickly, the real economy sometimes continued expanding for years afterward. Some economists explain this by arguing that "when central banks adjust rates swiftly or fiscal policy strongly underpins the economy, the yield curve's predictive power weakens." Also, in the period after quantitative easing (QE) became standard, central banks' large-scale long-bond purchases artificially suppressed long-term yields, producing instances where growth slowed without an inversion occurring.
Therefore, when reading the yield curve, it is not enough to simply ask whether it has inverted. You also need to examine the depth of the inversion (how large the negative spread is), the duration (is this a days-long inversion or a multi-month one), and the manner of normalization (did long-term rates rise to normalize, or did short-term rates fall?).

Why the Manner of Normalization Matters More
There is a point that many investors overlook. When the yield curve inversion resolves, the manner in which it does so completely changes the market environment. Normalization takes two paths.
| Normalization Path | Mechanism | Market Implication |
|---|---|---|
| Bull Steepening | Central bank cuts rates, lowering short-term yields | Expectations for economic defense → equities rebound, credit spreads may tighten. However, if cuts are in response to a recession, stock weakness can occur simultaneously |
| Bear Steepening | Long-term yields rise driven by re-emerging inflation expectations or similar | May signal a growth expectation recovery, but if driven by fiscal concerns or inflation re-ignition, it becomes a burden for risk assets |
Bull steepening (short-term yield decline) has historically appeared frequently when a recession is actually beginning or already underway — because the central bank cuts rates to defend the economy. Therefore, the interpretation that "the inversion has resolved, so we can relax" can itself be dangerous. Some analysts point out that the moment the inversion begins to resolve may be a more direct recession warning than the period during which the inversion is maintained.
Bear steepening (long-term yield rise) is even more complex to interpret. If long-term rates are rising on growth recovery expectations, it is a positive signal. But if long-term yields are rising due to expanding fiscal deficits, sovereign credit concerns, or re-igniting inflation, it can imply a stagflation path — a simultaneous instability in both growth and prices. This is why tracking not just the direction of the yield spread but also the cause is essential.
Current Context and the Judgment Framework
Since the 2020s, the debate around the yield curve's predictive power has grown more complex. With central banks' large-scale asset purchases and the pivot to quantitative tightening (QT), combined with geopolitical energy shocks, the rate structure is moving differently than before. As Korea Economic Daily reported, if simultaneous disruption to energy supply routes such as Hormuz and the Red Sea materializes, a sharp spike in crude prices could simultaneously raise inflation expectations and push up long-term rates while also amplifying growth slowdown fears. In that case, the yield curve could reflect economic anxiety without even inverting.
A sound judgment framework for using the yield curve as an analytical tool is as follows. First, confirm the depth and duration of inversion in numbers — a brief inversion and one that has persisted for multiple months are qualitatively different. Second, observe the direction in which the inversion resolves. Short-term yield decline (bull steepening) means treating recession onset probability as higher. Third, cross-check credit spreads (corporate bond to government bond yield differentials). When yield curve inversion and credit spread widening appear simultaneously, they signal stress across the financial system. Fourth, cross-reference labor market indicators. The environment when only the yield curve is inverted but the labor market is stable differs entirely from the environment where employment indicators are deteriorating simultaneously.
The conditions under which this signal fails must also be clearly recognized. In scenarios where the central bank directly purchases long bonds to artificially suppress long-term yields (yield curve control, YCC), where large-scale fiscal stimulus strongly supports real economic activity, or where an unexpected productivity breakthrough (such as AI-driven efficiency gains) lifts potential growth — yield curve inversion can end as a false alarm. As former Naver AI research director Ha Jeong-woo has emphasized, if the productivity effects of AI technology materialize, the potential growth path itself changes, potentially weakening the traditional yield-spread-to-recession linkage — a factor worth considering in the long-term context.
What to Watch
- 10-year/2-year yield spread level: Track inversion status and whether the spread is widening or narrowing on a weekly basis
- 10-year/3-month yield spread: Much academic research rates the 3-month-based inversion (directly tied to the Fed policy rate) as having higher recession predictive power
- Manner of inversion normalization: Confirm whether resolution occurs via short-term yield decline (bull steepening) or long-term yield rise (bear steepening)
- Credit spread trends: Investment-grade and high-yield corporate bond spread widening — if simultaneous deterioration with the yield curve occurs, signal strength increases
- Leading labor market indicators: Trend in initial jobless claims and share of temporary employment — leading employment indicators
- Central bank asset purchase policy changes: QT pace adjustment or introduction of YCC — if artificial long-rate suppression is at play, the yield curve indicator requires re-evaluation
- Energy supply-route risk: Speed at which geopolitical shocks from Hormuz, the Red Sea, and similar routes feed into inflation expectations — if this drives long-rate upward pressure, yield curve interpretation becomes more complex