
When the risk-free rate moves, the baseline for every asset moves with it. A US 10-year Treasury yield hovering around 4.5% is not merely a one-digit change — the denominator used to calculate the fair value of stocks has fundamentally shifted. This article focuses on the mechanism through the lens of concepts and judgment frameworks. It is a note on how to interpret interest rate changes, not a buy or sell signal for any specific stock.
What Is a Discount Rate — What It Means When the Denominator Changes
The theoretical value of a stock is the sum of its future cash flows pulled back to the present. The rate used to convert those future cash amounts into "what they are worth today" is the discount rate. The discount rate is typically composed of the risk-free rate (the US 10-year Treasury yield) plus the individual stock's equity risk premium (ERP). When the Treasury yield rises, the base of the discount rate formula goes up — so even if the risk premium stays the same, the total discount rate rises with it.
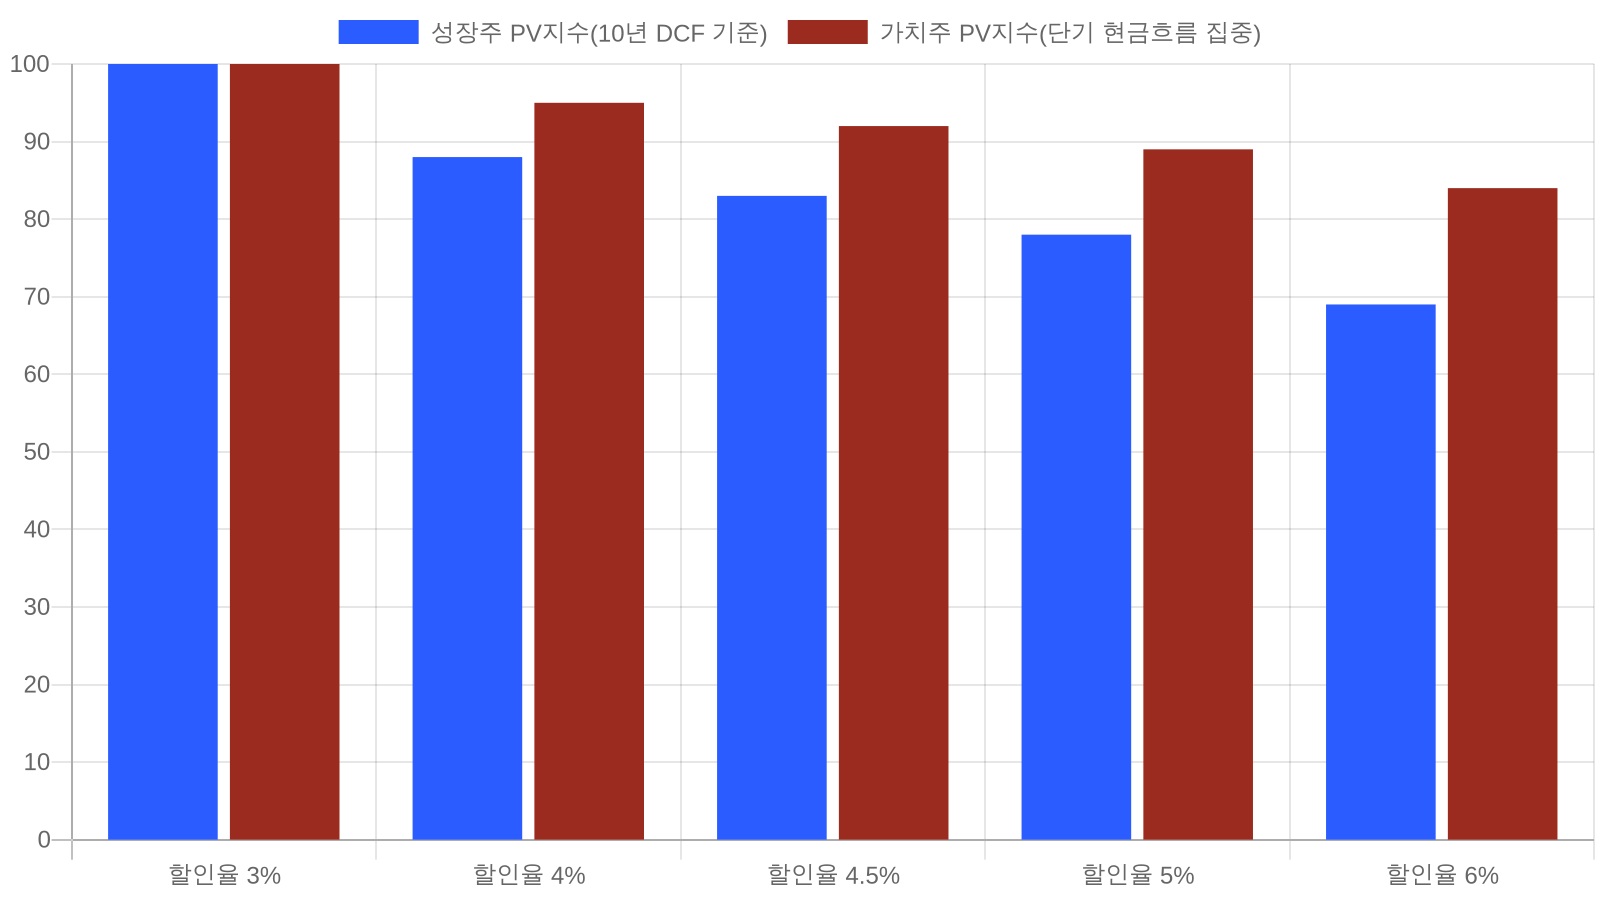
A higher discount rate means the present value (PV) of future cash flows shrinks. For example, the present value of 100 in profits realized 10 years from now is roughly 74 at a 3% discount rate, about 64 at 4.5%, and about 56 at 6%. Even though the absolute amount is the same, it shrinks considerably when converted into "the current stock price." Companies whose stock prices already reflect earnings far into the future are hit hardest.
The important thing is that this logic works symmetrically. If rates fall again, the same earnings are valued more highly. Therefore, more than the number 4.5% itself, what matters most is the market's expectation of how long this rate will persist and in which direction it will move.
Why Growth Stocks and Value Stocks React Differently
The key point is that the impact of rising discount rates does not hit all stocks uniformly. Depending on whether a company's cash flows are generated right now or concentrated 5 to 10 years out, the magnitude of the shock from the same rate increase can be completely different.
| Category | Cash Flow Concentration | PV Sensitivity to Rate Rise | Representative Characteristics |
|---|---|---|---|
| High-growth stocks | 5–15 years out | Very high | Little or no current earnings, high P/E |
| Value / dividend stocks | Within 1–3 years | Relatively low | Stable current earnings, low P/E |
| Treasury bonds (10-year) | Fixed coupon until maturity | Directly tied to duration | Principal guaranteed, no credit risk |
High-growth stocks justify their elevated prices by expecting explosive earnings growth years into the future, even though current earnings are minimal or negative. But when the discount rate applied to pull those "future earnings" back to present value rises, the numerator (future earnings) stays the same while the denominator grows. As a result, high-growth stocks face stronger valuation pressure in a rising-rate environment.
Value and dividend stocks, on the other hand, have cash flows concentrated in the near term, making them relatively insensitive to changes in the discount rate. Of course, they can still be directly affected by rate hikes (through higher interest costs) depending on their cyclical exposure and debt levels. This is why investment decisions cannot be made based on discount rate logic alone.

The Level of 4.5% — Historical Context and Coordinates for Judgment
A 10-year Treasury yield of 4.5% is not particularly high by pre-2000s standards. But for market participants who experienced the era of zero interest rates and quantitative easing throughout the 2010s, it feels unfamiliar. A rate that fell to the 0.5–1% range around 2020 surpassing 4% means the benchmark used to assess the relative attractiveness of stocks has itself shifted.
Rising rates are a process of restoring the time value of money — the era when only stocks offered returns is ending, and we are transitioning to an environment where safe assets again deliver real returns.
The so-called "TINA" (There Is No Alternative) logic — that there was no alternative to stocks in the low-rate era — loses its persuasive power in the face of Treasury yields above 4%. When government bonds offer a guaranteed 4.5% pre-tax return, investors demand that stocks deliver expected returns above that (including ERP). As required returns rise, corporate earnings must grow faster to justify current stock price levels.
The conditions under which this logic breaks down are also clear. First, if inflation falls rapidly and the Fed pivots to a rate-cutting path, 4.5% becomes a temporary peak. Second, if corporate earnings growth significantly exceeds market expectations, higher discount rates can be offset by earnings gains. Third, geopolitical shocks could cause a surge in safe-haven demand for Treasuries, bringing rates down faster than expected. As noted in current sources, oil supply chain instability in the Hormuz and Red Sea regions is a variable that disrupts the inflation trajectory — if energy prices rise, the Fed's timeline for rate cuts could be pushed back.
Summary Framework — A Checklist Individual Investors Can Build for Themselves
When interpreting a 4.5% rate environment, here is a judgment structure individual investors can use to review their own portfolios. This is not a buy or sell signal, but a tool for understanding the sensitivity of assets they hold or are interested in.
First, understand the "duration" of your holdings. In equities, duration means how far into the future cash flows are concentrated. A stock with a P/E above 100 reflects expectations of earnings years out, making it very sensitive to rate changes. A stock with a P/E around 10 has a relatively higher share of near-term cash flows. If you hold a mix of both types, you need to understand that they move in opposite directions during rate-rising and rate-falling periods.
Next, you can check whether the expected return of your current stock holdings is adequate relative to Treasuries. You can gauge this quickly using the equity risk premium (ERP) — subtract the Treasury yield from the earnings yield of an index like the S&P 500 (Earnings Yield = 1/P/E). If this gap has narrowed significantly below the historical average, the relative attractiveness of equities has weakened. Conversely, if the gap is wide, equities may have room to absorb rate increases.
What to Watch
- Real-time level of the US 10-year Treasury yield — If it breaks above 4.5% (toward 4.8%+), watch whether valuation pressure on high-P/E stocks reignites
- Fed FOMC meeting results and dot plot — How much does the pace and magnitude of rate cuts diverge from market expectations
- US CPI and PCE releases — Whether inflation is converging toward the 2% target, or being reignited by energy price increases
- S&P 500 Earnings Yield vs. 10-year yield spread — Check monthly whether the gap is above or below the historical average (roughly 1.5–2.0 percentage points)
- Middle East geopolitical risk — Whether simultaneous instability in Hormuz and the Red Sea leads to oil supply disruptions that affect the inflation trajectory
- P/E trends in high-growth sectors (AI, semiconductors, etc.) — After each quarterly earnings release, check whether premium valuations are being justified by earnings growth in a rising-rate environment
- Dollar Index (DXY) — If rising rates are accompanied by dollar strength, watch whether this creates additional pressure on emerging market assets and commodities